The Forces Behind Historic CMBS Issuance in U.S. Market

The record issuance of Commercial Mortgage-Backed Securities in the United States since the Great Financial Crisis of 2007 has drawn significant attention following Q3 statistics and Q4 predictions. The makeup of these findings reveals the market landscape for major CRE markets across major cities. A steady multi-family market, the surge of high-performing trophy office space, and previously suppressed markets have all led to historic highs for CMBS issuance. By first covering the fundamentals of the market and then providing insights into what 2026 could look like, I look to explore the major changes. Before diving into why this is important, it is vital to understand the core concepts of commercial mortgage-backed securities.
Commercial Mortgage-Backed Securities (CMBS) are generally pools of multiple loans on varying commercial real estate assets combined into a single security. This type of CMBS is considered a conduit CMBS, as the loans within it are medium- to small-sized. These securities are then cut into what are called “tranches”, or sections of the CMBS. The tranches, varying in risk and return, are then sold to investors ranging from pension funds, which often invest in the less risky tranches, to hedge funds, which purchase higher-risk tranches for greater returns.
Within the CMBS world, there are also vehicles called Single-Asset, Single-Borrower (SASB) CMBS. For the most part, these securities consist of single large loans on high-performing assets, positioned in a strong market.
The peak of CMBS issuance was nearly two decades ago, directly preceding the Great Financial Crisis. According to Trepp, $230.5 billion in CMBS issuance occurred in 2007, the highest on record in the United States. On this occasion, the high issuance was highly misleading, as the number was artificially inflated due to a market lacking transparency. During this time, Commercial mortgage-backed securities were rated far above their accurate risk profiles, creating high demand for high-risk securities. Given the market conditions at the time, this year is not a reliable reference point for comparing issuance levels over the past 15 years.
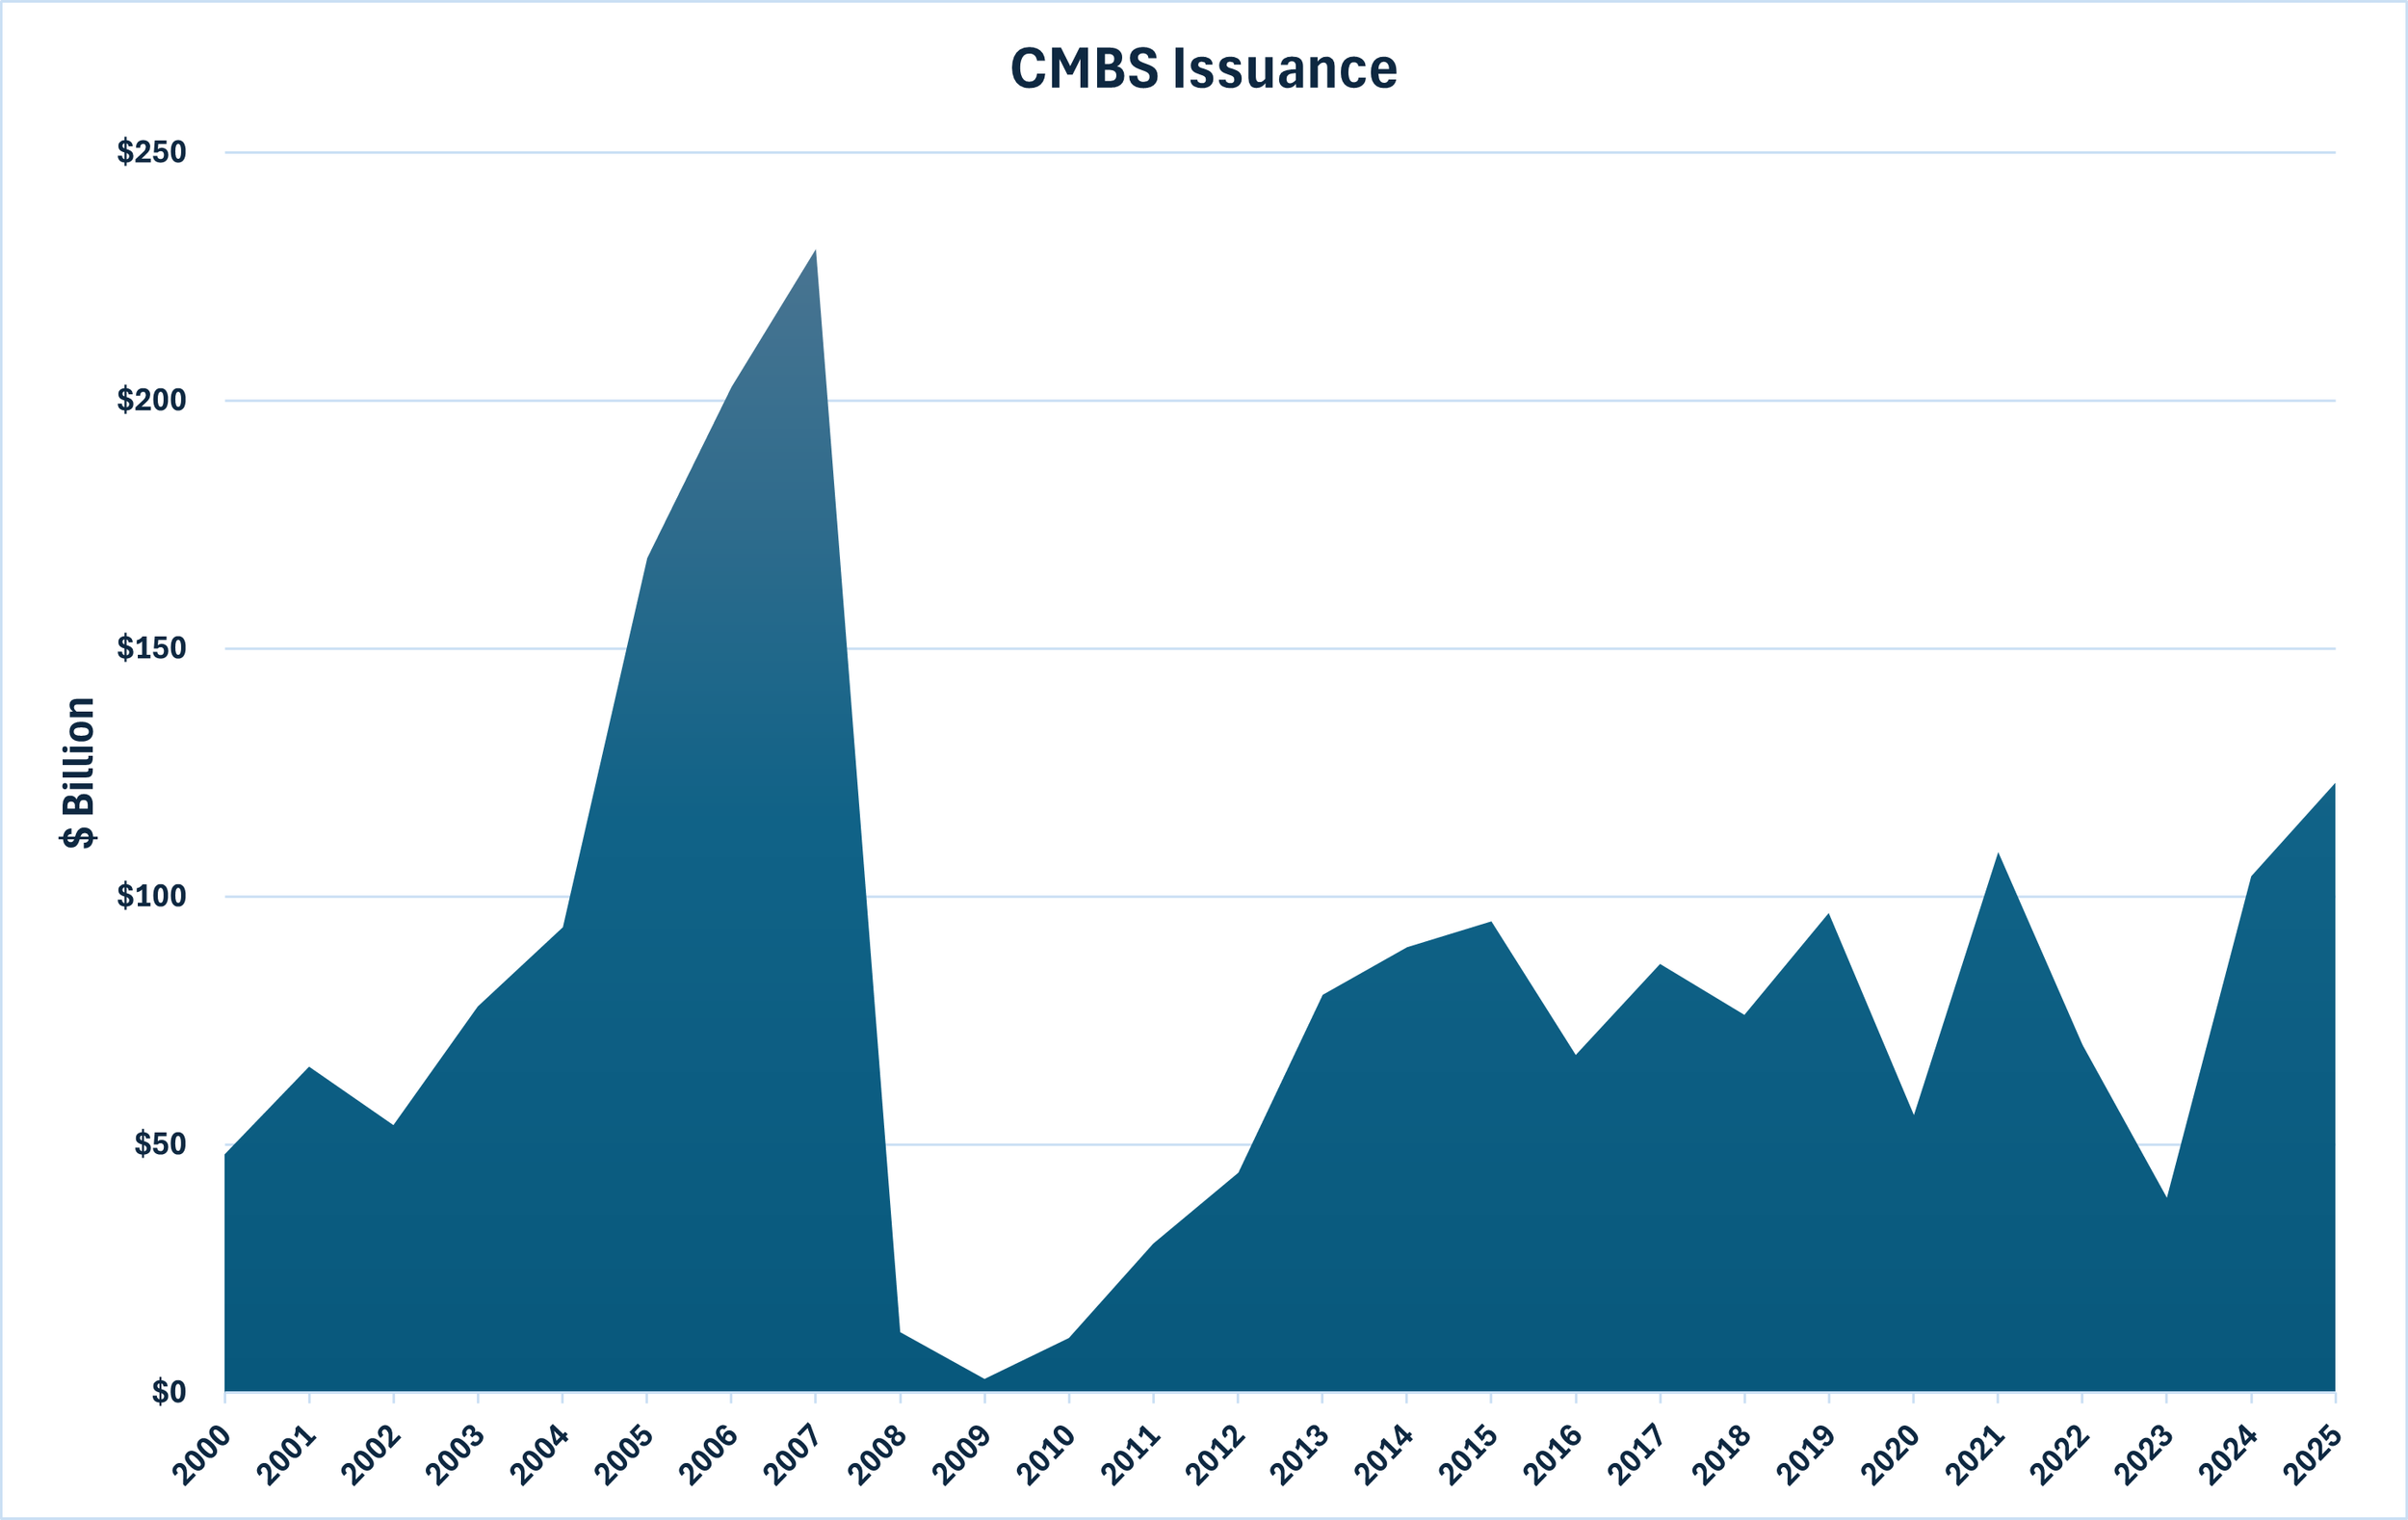
It's best to focus on the point at which the economy recovered from the GFC and beyond as an indicator of the market's demand. Between 2013 and 2019, average CMBS issuance stood at $84.65 billion per year, according to Trepp.
Setting this as a benchmark, 2025 is projected to exceed $123 billion in CMBS issuance, as the first three quarters of 2025 alone saw $92.49 billion in volume, according to Trepp. With issuance levels this high, the strong appetite for CMBS investment has become clear. The makeup of these issuances can reveal a lot about the health of specific real estate sectors.
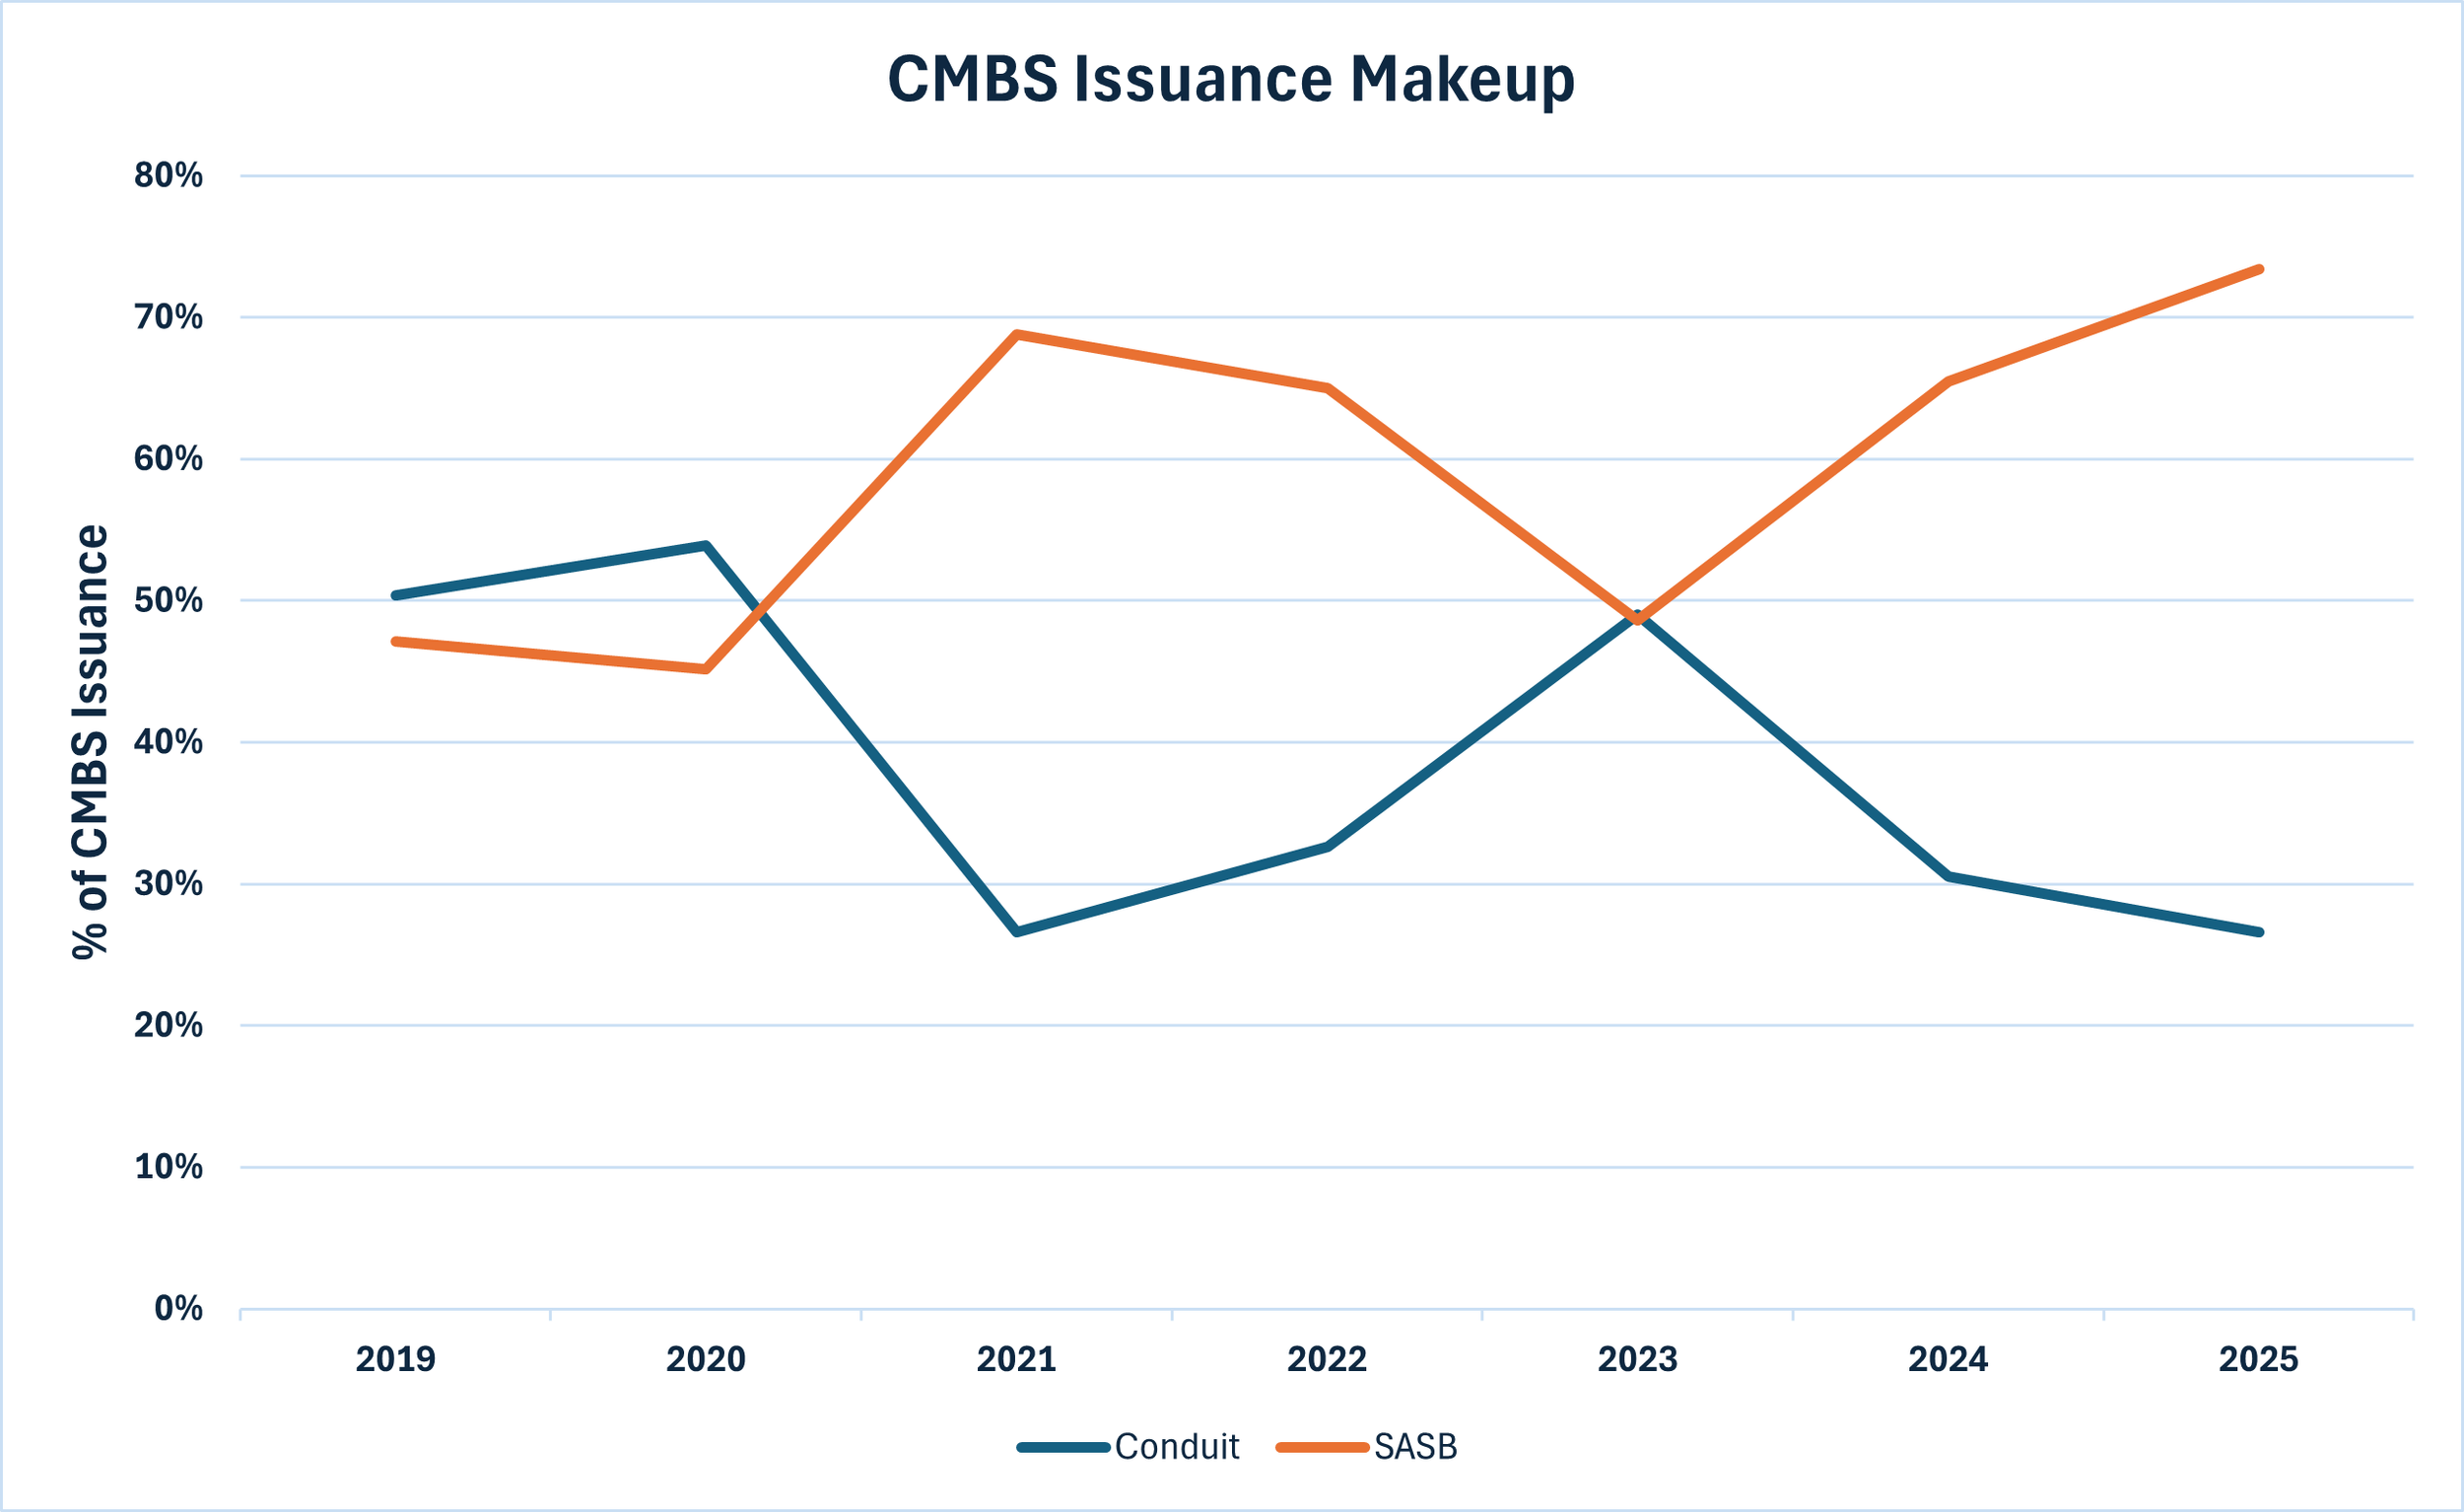
As shown in the figure above, the composition of total CMBS issuance varies significantly year to year. According to Trepp, in 2025 thus far, SASB has accounted for 73.4% of total issuance volume, compared to just 47.1% in 2019. The high concentration of SASB CMBS is directly tied to the high-performing trophy office assets in major cities, as 27.18% of SASB issuance was made up of office assets, nearly 900 basis points ahead of the next asset class, according to Trepp.
According to CRE Daily, One Five One, a trophy office asset located in Times Square, New York, was refinanced utilizing a $1.3 billion CMBS loan in August of 2025. The largest of all SASB CMBS issuances this year was derived from a $2.85 billion loan, one of Hudson Yards, New York’s trophy office assets, with $2.65 billion allocated to CMBS, according to Trepp. Twenty transactions this year have surpassed $1 billion, primarily located in highly dense cities.
Through the first 9 months of 2025, SASB issuance has increased by nearly 38% compared to the same time last year. Given the high concentration in trophy office assets, I don’t necessarily see this as an indicator for what to expect in the future. Office space across the country went through a huge downturn following COVID, and elevated rates during 2023 and 2024 didn’t help. I see this surge in demand as more of a spillover for refinance deals that were suppressed over the past two years.
Another major factor in CMBS issuance is the steady trust and performance exemplified in the multifamily asset class. Multifamily-allocated conduit issuance is up nearly 500 basis points from last year and has generally been favored due to its lower risk profile for lenders, according to Trepp.
Despite SASB deals accounting for nearly three-quarters of total issuances, conduit deals have continued at a healthy rate. Conduit issuance is up 4.7% in the first nine months of 2025, compared to the same timespan in 2024, according to Trepp. In fact, office assets have also seen a 2% increase in deal percentage from the same time last year, according to Trepp, indicating a move in the right direction for lower-level office assets as well.
A Look to the Future
The Fed’s most recent 25 basis point cut on December 10th, 2025, is a move in the right direction; however, the median rate-cut projection for 2026 is only one more 25 basis point cut. One more rate cut in the new year is unlikely to spark a significant increase in CMBS issuance. In fact, the U.S. 10-year Treasury actually rose over 2 days, despite the cut. I will add that this projection was based on minimal October economic data due to the shutdown, so with a promising CPI of 2.7% in November, announced this morning, we may see sentiment towards more cuts change by the next time the Fed meets.
Looking ahead to 2026, I wouldn’t be surprised to see a similar level of issuance next year, especially if inflation continues to decline. That being said, I certainly wouldn’t expect a similar year-over-year growth to what was just experienced. The spillover effect is real, but with the market being suppressed for roughly two years, I think we could see a ton of deal volume carry over into the beginning of 2026.
Sources:
Trepp - CMBS Issuance Remains Healthy in Q3 2025, Driven by Single-Borrower Deals
Trepp - Analyzing CMBS Issuance Trends from 2019 to 2024
CRE Daily - Times Square Refinancing Earns Durst $146M Equity Windfall